

Thanks!
We got your message and will be in touch as soon as possible.
Nice to meet you!
We'd love to hear more about you and your ideas.


The Latest


01 Jul 22
|
Page Speed
Tips on how to understand Google’s page speed scores
'Roundup' is the collection of key stuff we've either been reading, discussing or working on during the month at Avenue.
If you’ve ever run one of Google’s page speed ranking tools (and yes, there’s several different ones), you’ve no doubt been left wondering the following…
- Why is mobile speed so much slower than desktop?
- Why does the score vary – sometimes massively – every time I run a test?
- Why does the score vary between Google’s own ranking systems?
- And what is the difference between the different Google ranking tools?
So let’s start at the beginning…
Why is mobile speed so much slower than desktop?
There’s two main reasons for this.
Mobile devices have different hardware than desktop computers
Desktop computers have more powerful processors, and they often have more reliable connection speeds to the internet than mobile devices on either a carrier’s data network, or wi-fi connection.
So the very nature of the different devices means you are going to get different experiences, and this can often mean that loading sites on mobile devices may be slightly slower than on a desktop computer — even if the site is built to standards and has been optimised for mobile.
Google’s speed tests are measured at slow 3G connection speeds
The Google speed tests are run at throttled 3G connection speeds (note: recent updates now provide throttled 4G connection speeds).
So the speed rankings are not based on real world customer experiences.
3G networks were launched in 2002. So by today’s connections speeds we are talking SLOW.
The nature of different devices means you are going to get different experiences, and this often means that loading sites on mobile may be slightly slower than on a desktop computer.
Issues with Google’s speed ranking tools
Google has 3 main tools that measure performance metrics:
- PageSpeed Insights
- Lighthouse
- Core Web Vitals
The PageSpeed Insights tool only connects to 4 server locations globally
Google’s PageSpeed Insights only accesses your website site via one of 4 server locations globally:
- Northwestern USA (Oregon)
- Southeastern USA (South Carolina)
- Northwestern Europe (Netherlands)
- Asia (Taiwan)
So what’s the issue here?
It is probably not testing your site via a locally based web server location. For example, if you are an Australian businesses who’s websites are hosted locally, this is means you are likely to see ranking scores stating lower speed than what users are actually experiencing.
Depending how good the connection is to the server at the point of time of running the test will vary the result – hence why sometimes you get very low and different scores.
Google Lighthouse scores using lab data
Lighthouse scores websites using what Google describes as ‘lab data’, which scores a website’s performance on a ‘single device and fixed set of network conditions’.
So what this means is the score is based on results from the site being analysed through the Inspect/Google Developer tools in your browser running on your computer.
Some believe that because of this Google Lighthouse is a better test indicator than PageInsights. However whilst it is not a score based on a potentially bad connection to a server on the other side of the world, it needs to be kept in mind that your computer speed (i.e. CPU performance) “may” also impact results slightly.
Core Web Vitals
The inconsistencies in the reporting tools is one reason why Google is now moving to Core Web Vitals to be its main ranking mechanism.
Core Web Vitals scores sites based on a rolling and accumulated 28 days of data from real ‘field’ and ‘lab’ tests. Hence its results will not be based on a single test that may be heavily influenced by outside factors.
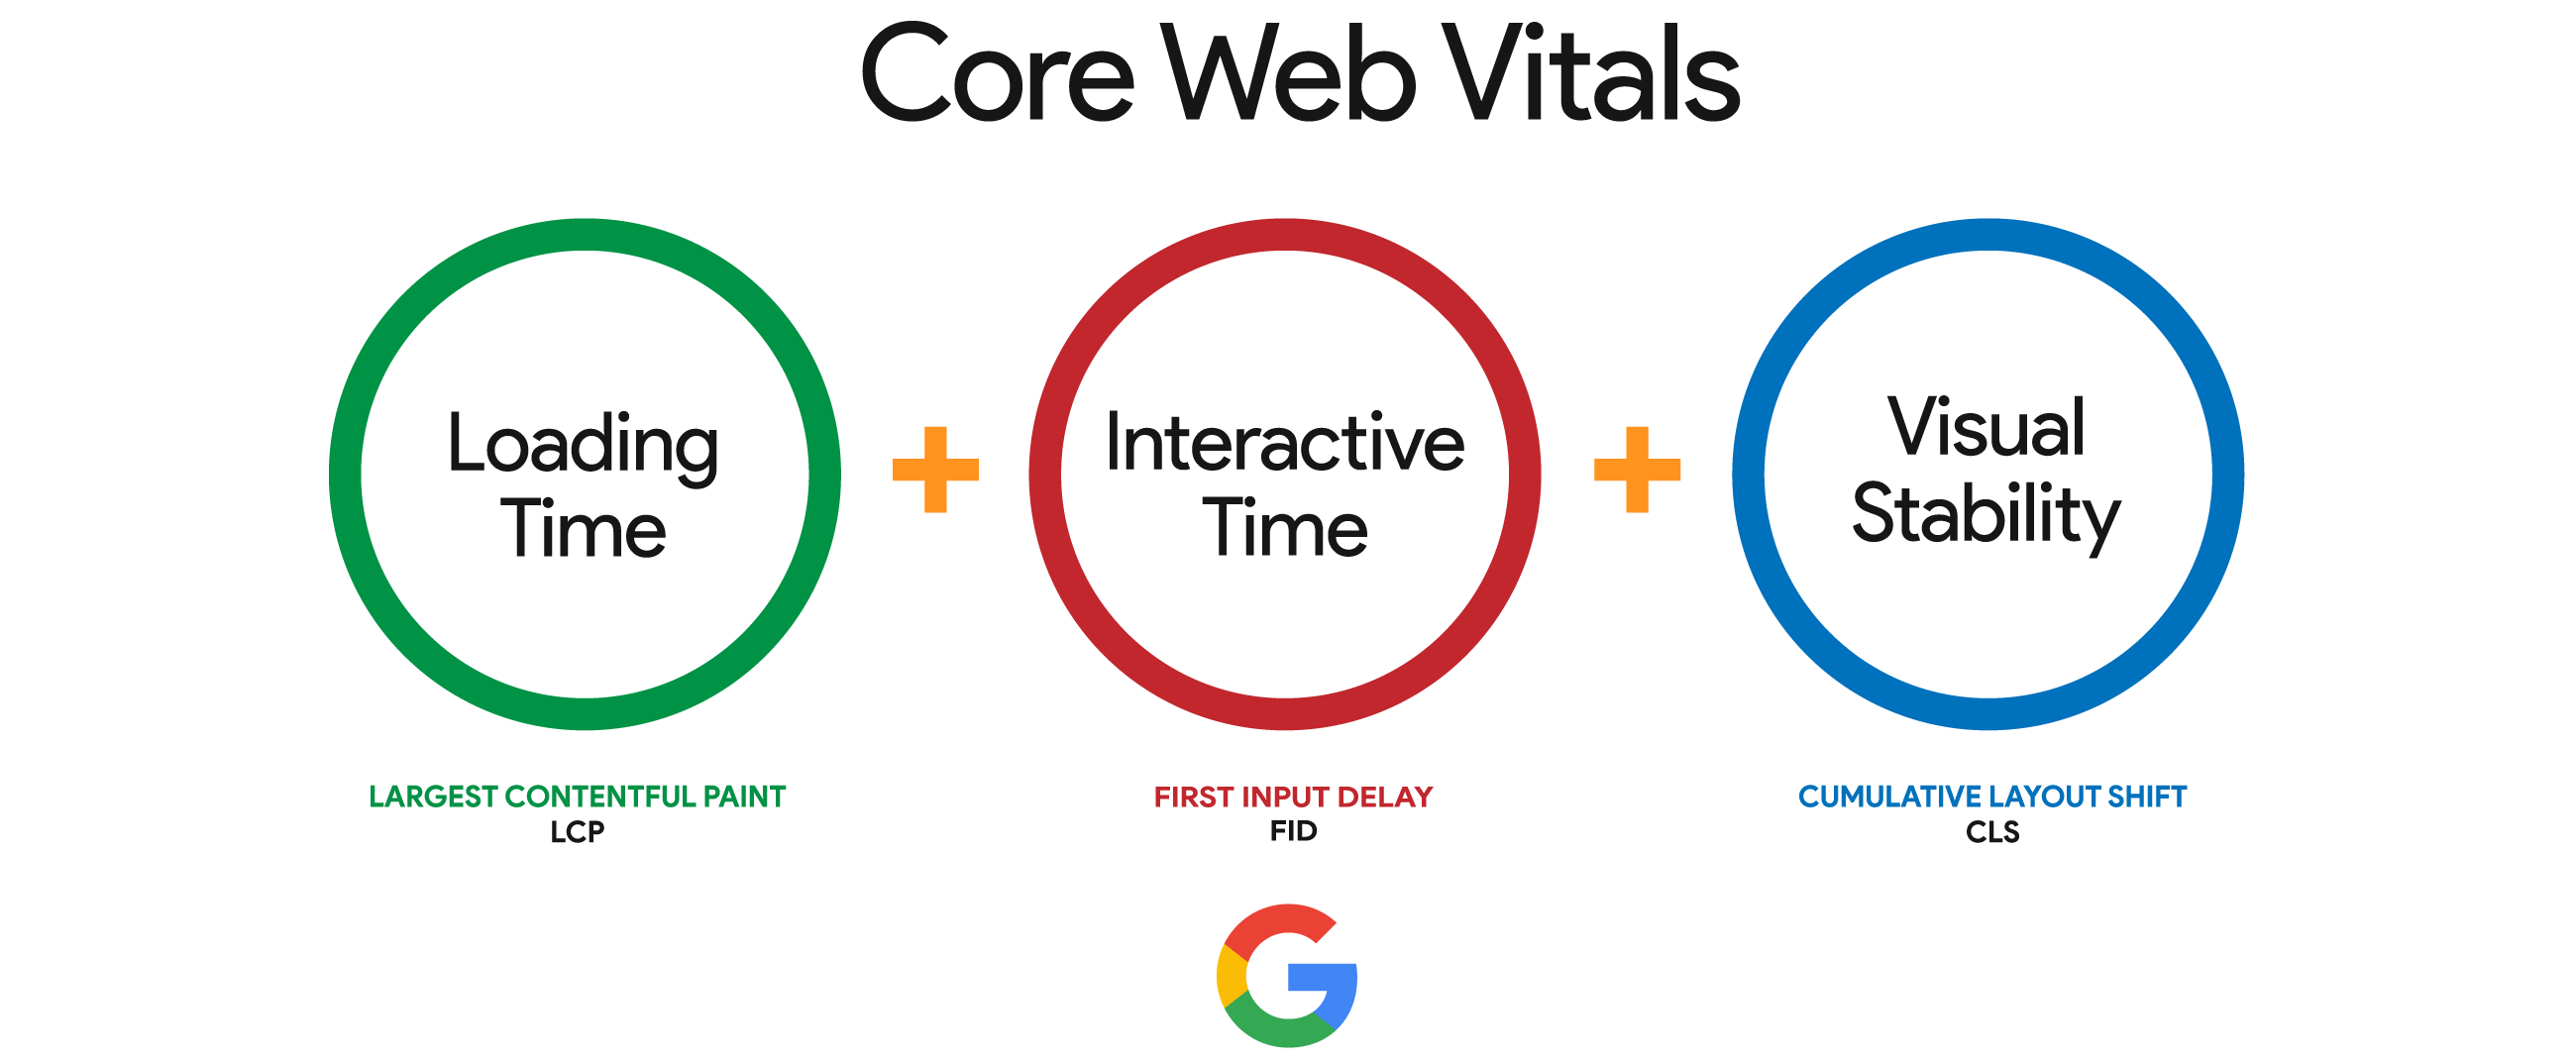
Understanding the 3 key criteria with Google’s Core Web Vitals
Google’s new website analysis metrics, Core Web Vitals, is all about analysing a website from a user experience perspective.
There’s 3 main testing criteria Google ranks:
- How long it takes all elements on your web page to Load.
- The time it takes to be able to Interact with your web page, which is different to load time. For example, how quickly can I interact with a form or click a navigation button.
- The Visual Stability whilst a web page loads. This aims to address a really annoying issue that plagues many websites, which is page elements jumping and moving position on the screen as the page loads. It’s an issue because it makes the page very hard to read and properly interact with as it loads.
Why is Google focusing on Core Web Vitals?
It is all part of their wider “Web Vitals” initiative, which is all about delivering better web experiences for people.
The thing to keep in mind is, it is not only important how fast your web page loads, HOW it loads is now just as important.
Other considerations to be aware of…
It’s just an indicative score that doesn’t always correlate with the real world
The Google PageSpeed score is a “guessed estimate” based on artificial testing and random factors. It is important to acknowledge that it is an indicative tool, and in many cases is not accurate to a users real world experience.
You can artificially tweak a site to score higher speed than actually exists
A developer can also tweak a sites code to get a high speed ranking when it may actually be a slow as a tortoise. This can be done completely artificially, meaning it doesn’t always correlate to being a fast site for a person to use.
This issue has been proven by web performance experts in this research: Making the slowest ‘fast’ page
Low scores due to Google’s own scripts
One of Google’s main ranking criteria is the time it takes to load JavaScript.
Ironically, Google Analytics, Google Search Console and Google Tag Manager scripts are .js based and often are main causes of low ranking scores on their own systems.
But does a user even care if scripts are taking a few seconds to load in the background whilst the site is already completely visible and usable?
How you need to run Google speed tests
If you are using any of Google’s tools to test your website page speed, there’s two really important aspects to be aware of when running the tests.
Always run multiple tests
You can’t just run one single test. It is widely accepted you need to run at least 3 to 5 tests in a row to get an accurate idea on your score.
This helps account for poor server connections, and you will see that scores sometimes vary widely.
Always run tests in “Guest” mode on Google Chrome
Make sure you always run tests in “Guest” mode on Google Chrome, as this disables all extensions that may be installed in your browser software that can impact score ratings.
If you are not sure how to use Guest mode, here’s the instructions on how to activate it.
If you follow these 2 steps, you’ll be able to capture much more meaningful results.
At the end of the day, the only thing that matters is what your audience experiences directly themselves.
The best tip for truly seeing how fast your website is…
If you want the best tip for truly seeing how fast your website is, view it yourself on a number of different devices:
- Clear your browser cache
- Check it on your phone
- Check it on your iPad/tablet
- Check it on your computer
This is the real world experience that people have when they are accessing your site.
This is what matters.
This more than anything, will be able to give you the best indication if your site is fast or not.